

This article is the second part of the findings of the research project ‘Project Fleet’, conducted by the Ecol Oil Analysis Laboratory. Links to previous articles can be found below:
FLEET PROJECT – ASSUMPTIONS
PART 1: ANALYSIS OF WEAR ELEMENTS.
This article is the second part of the findings of the research project ‘Project Fleet’, conducted by the Ecol Oil Analysis Laboratory. Links to previous articles can be found below:
FLEET PROJECT – ASSUMPTIONS
PART 1: ANALYSIS OF WEAR ELEMENTS.
In this article, we will try to answer the question of what is a safe oil change interval. To give you an idea of the meaning of the article, we refer you to the first part, in which the topic of safe wear element content was considered. When analysing the results, the mileage since oil change, fuel type and oil type were taken into account.
In order to determine a safe oil change interval, it is necessary to determine the oil’s ageing parameters. Oil ageing parameters are those that define the degree of degradation of an oil. These certainly include the alkali number, acid number and i-pH. In addition to these, flash point and kinematic viscosity are distinguished, which also change during the life of the oil. The mileage since oil change was taken as the operating time. Based on the mileage since oil change, changes in parameters were compared.
The alkali number expresses the number of milligrams of potassium hydroxide equivalent to all alkali components in one gram of sample. Alkali components are understood to be certain additives that enhance the oil, so a decrease in its number indicates a loss of ability to neutralise acidic combustion products. The acid number, on the other hand, is the amount of all components of an acidic nature. It is assumed that the value of the acid number must not be higher than the value of the base number. It is assumed that once the base number exceeds the acid number, the alkaline reserve of the oil is exhausted.
An additional parameter to help assess the risk of strong or weak acids is the i-pH. The i-pH value of the oil in service should not be lower than 4.5. A significant decrease in this value together with a significant increase in the acid number indicates the presence of strong and weak acids. A high acid number and high i-pH may indicate the presence of weak acids, such as carboxylic acids or phenols, which are additives that are not harmful, but are intended to prevent oxidation. [1] The FTIR parameters oxidation, nitration and sulphation were also taken into account during the analysis. The additive content of the elements determined in the study was also analysed.
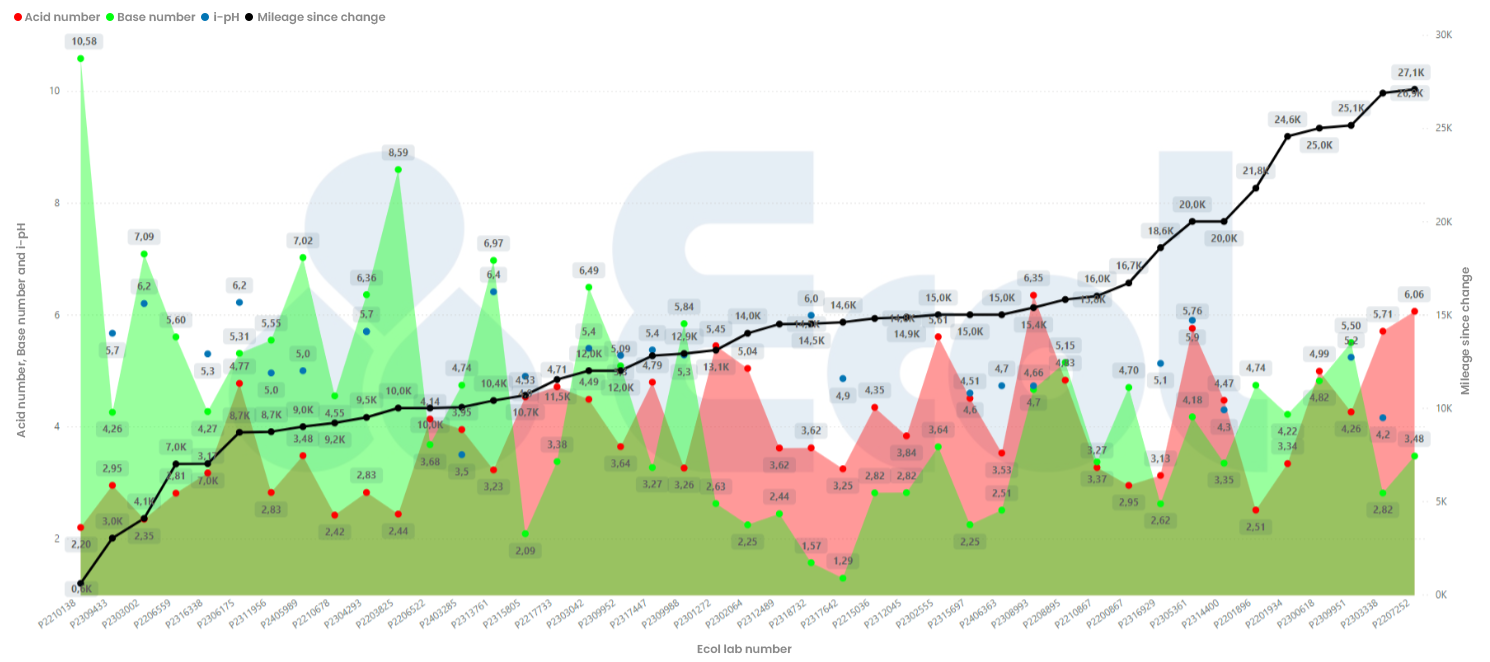
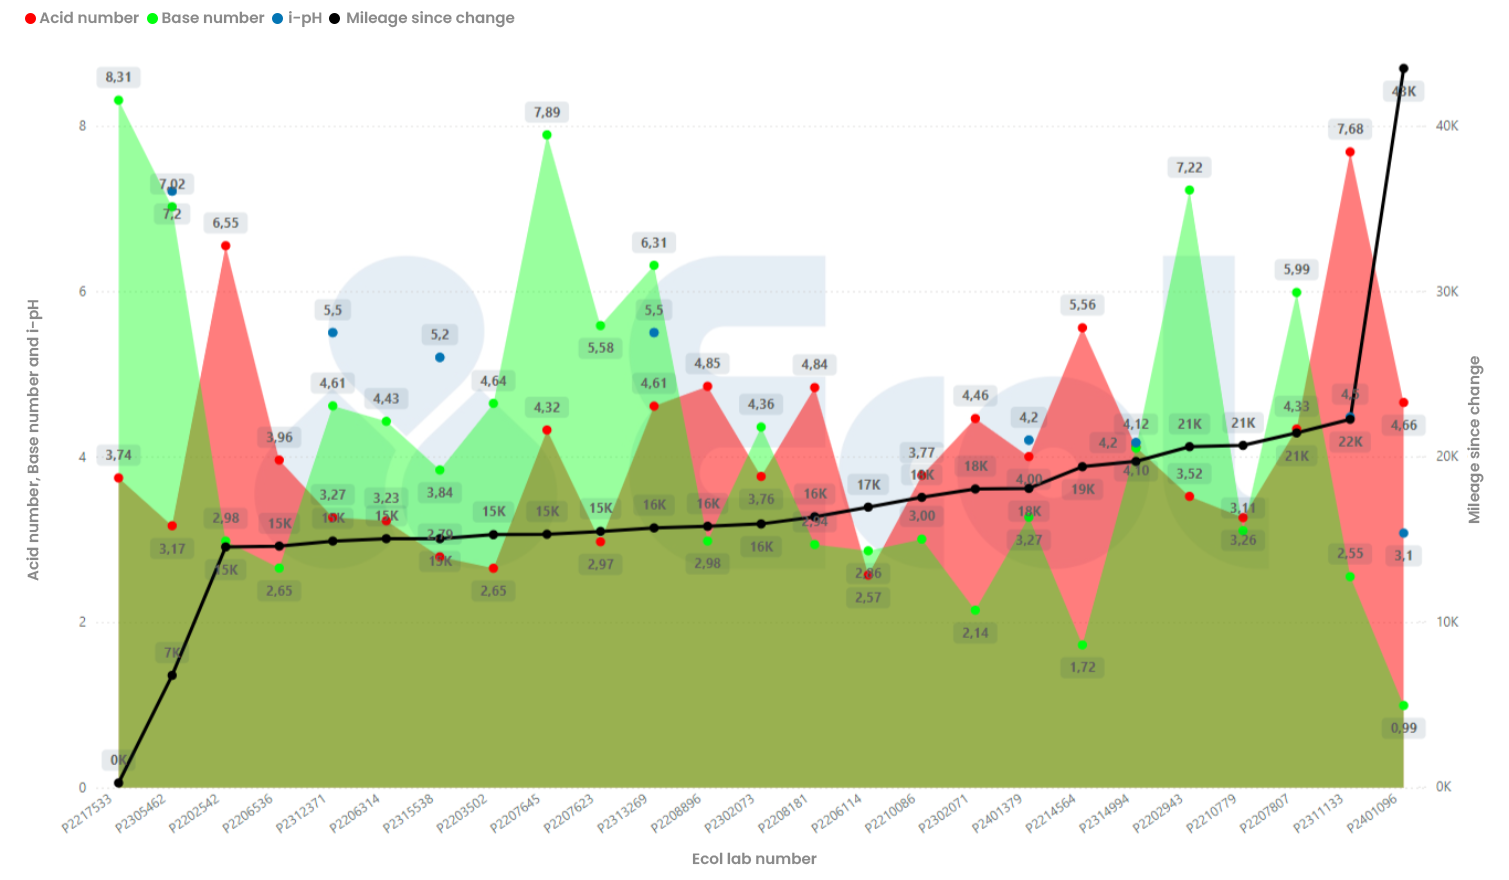
Figures 1 and 2 show the variation of base number versus acid number and i-pH values as a function of mileage, expressed in kilometres since oil change, for petrol and diesel engines. The X-axis shows the sample numbers from the various cars discussed, among others, in the first part of the article. On the Y-axis, the left-hand side shows the alkali, acid and i-pH values, while the right-hand side of the Y-axis shows the mileage of the respective car since oil change. The graphs should be read from the left, where the mileage expressed in kilometres increases from left to right.
In Graph 1, it can be seen that the first time the acid number exceeds the alkaline number occurs after 10.7 thousand km, followed by the acid number after 12.8 thousand km, and then the values are repeatedly exceeded after 13 thousand km (with a few exceptions). In Figure 2, the acid number exceeds the alkaline number value for the first time after 14,500 km, then repeatedly after 15,700 km, with the exception of three samples.
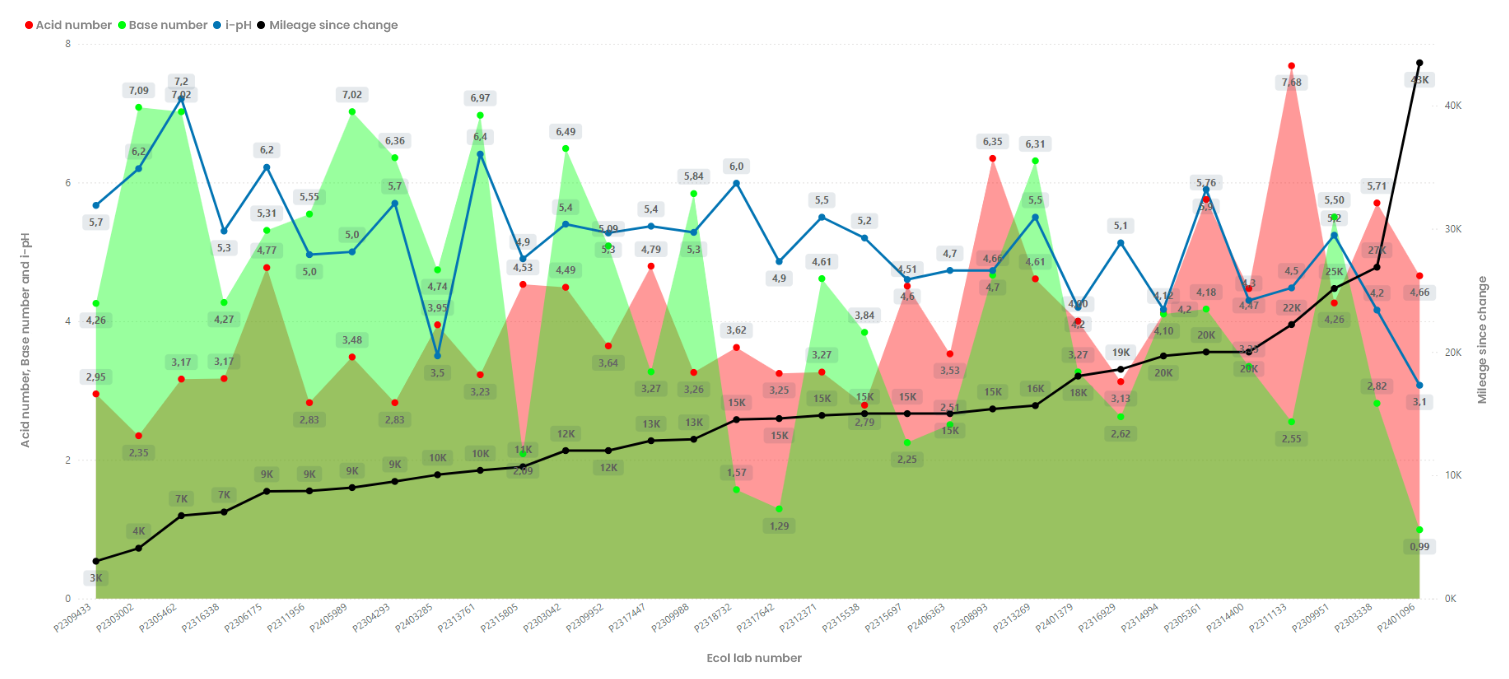
In Figure 3, it can be seen that for sample number P2403285, despite still having a safe alkaline reserve, the i-pH value is 3.5. This indicates the presence of strong acids. Interestingly, this case concerns the only car in this compilation with a gas installation. It can be suspected that this is related to higher engine operating temperatures than for the petrol engine, which translated into faster oil degradation. Further samples in which the alkaline reserve was depleted and the i-pH was above the acceptable value require a deeper analysis and the presentation of the other key parameters.
*- Acid N. (Acid number)
– Base N. (Base Number)
– Alk. (Alkaline Reserve) – represents the result of dividing the base number by the acid number. A value ≥ 1 is considered acceptable.
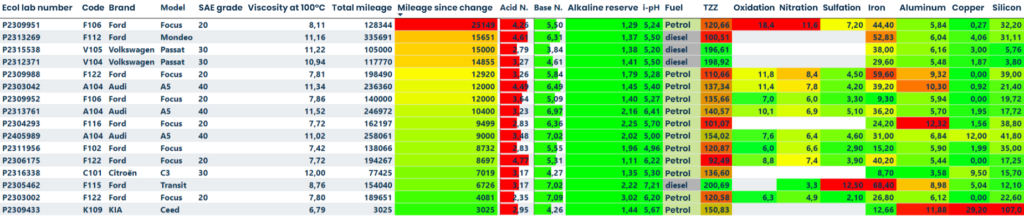
W tabeli 1 wyszczególniono wszystkie parametry, które mogą korelować z rezerwą alkaliczną i i-pH lub mogą przesądzić o dyskwalifikacji oleju. Kolory w tabeli nie zawsze oznaczają wartości przekroczone; mają również za zadanie zwrócić uwagę czytelnika.
W powyższej tabeli zestawiono próbki, które są widoczne na wykresie 3 i spełniają dwa warunki: rezerwa alkaliczna oraz i-pH mieszczą się w bezpiecznych zakresach. W tym przypadku należy przyjrzeć się pozostałym parametrom.
Oznaczone wartości lepkości kinematycznej w 100°C mieszczą się w klasach SAE przypisanych do danej próbki, z wyjątkiem próbek z auta A104. Spadek lepkości jest sytuacją normalną dla oleju pochodzącego z eksploatacji. Ten przypadek jest szczególny, ponieważ wartość wyjściowa dla oleju świeżego mieści się w dolnym zakresie klasy SAE 40, a więc wartość lepkości spadnie szybciej poniżej dolnej granicy SAE wynoszącej 12,5 cSt. W takim przypadku należy zweryfikować wymagania producenta auta, czy dopuszcza pracę oleju o danej lepkości, ponieważ niejednokrotnie producenci dopuszczają pracę silnika z olejem w klasach SAE 30 oraz SAE 40.
Warto zwrócić uwagę, że temperatura zapłonu (metoda tygla zamkniętego) jest niższa w przypadku silników benzynowych niż w przypadku silników diesla. Jest to jednak sytuacja typowa. Nietypową sytuacją jest próbka pochodząca z samochodu o kodzie F112, z silnikiem diesla. Temperatura zapłonu wynosząca 100°C nie wskazuje na wyeksploatowanie oleju, jednak najprawdopodobniej jest związana z usterką auta, w którym przedostaje się nadmierna ilość paliwa do oleju.
Próbka K109 na dole tabeli ma podniesioną zawartość glinu, miedzi oraz krzemu. Nie wynika to jednak ze zwiększonych procesów zużycia elementów silnika, lecz z nowego silnika oraz past montażowych, co nie dyskwalifikuje oleju. W pozostałych próbkach nie zaobserwowano niepokojących wartości zużyciowych.
Próbka o kodzie F106, znajdująca się na szczycie tabeli, charakteryzuje się najwyższym przebiegiem od ostatniej wymiany oleju. W porównaniu do innych próbek odnotowano w niej podwyższone wartości oksydacji, nitracji i sulfacji. Oznaczone wartości nadal mieszczą się w dopuszczalnych granicach. Pozostałe parametry dla tej próbki również pozostają w normie. Jest to jedyna próbka w zestawieniu o tak wysokim przebiegu z jednocześnie akceptowalnymi parametrami. Dla innych próbek, które mają wartości parametrów w normie, przebieg nie przekracza 16 tys. km.
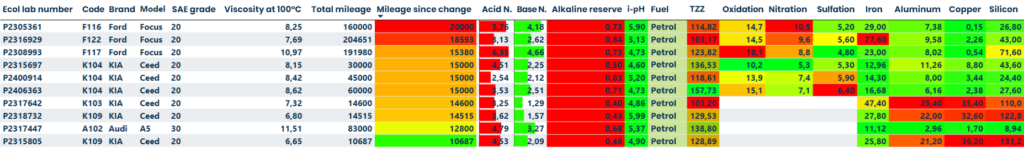
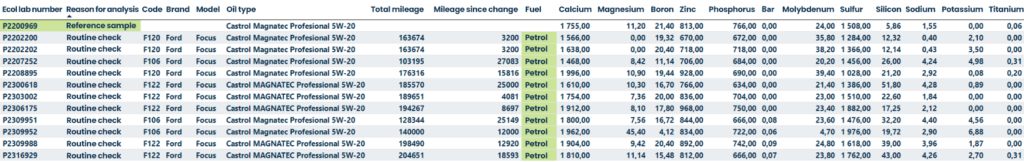
Table 2 is presented in the same way as Table 1. The above table includes cases where the alkaline reserve has been depleted, while the i-pH value is within the acceptable range.
For all cases, the determined kinematic viscosity at 100°C is within the standard, with the exception of the sample from vehicle code F117. This may be due to the use of SAE 30 grade oil, the accumulation of soot (products of combustion), and the general degradation of the oil, which has led to an increase in viscosity. It should be noted that the i-pH value is 4.73, suggesting that it may soon fall below an acceptable threshold. In addition, oxidation in this sample is higher than in the others. The accelerated deterioration may be related to the driving dynamics of the driver, leading to higher temperatures to which the oil is subjected and faster degradation.
All oils in which the alkaline reserve has been depleted and the i-pH remains normal have mileage above 10,000 km. As Table 1 shows, there are also oils with mileage above 10,000 km that retain an acceptable alkaline reserve. The question arises: are oils with a depleted alkaline reserve, but with a safe i-pH level, suitable for further operation? According to article [1], it is safe. A high acid number and high pH indicate a high amount of weak acids (carboxylic), while a low i-pH suggests the presence of strong acids (nitric, sulphuric), which pose a risk to the engine.
Analysing Tables 1 and 2 and samples with mileage >10,000 km since oil change, no direct correlation can be observed between mileage and alkaline reserve and i-pH. However, it is known that these parameters will deteriorate, albeit at different rates. For example, different i-pH and alkaline reserve values were observed for all KIA Ceed car samples, despite similar mileage since oil change in Table 2 and using the same oil.
The explanation for these differences is not obvious. It is suspected that it may be related to the additive package of the oil in question, its output values, the driving style of the driver and the nature of the routes taken (city/highway).

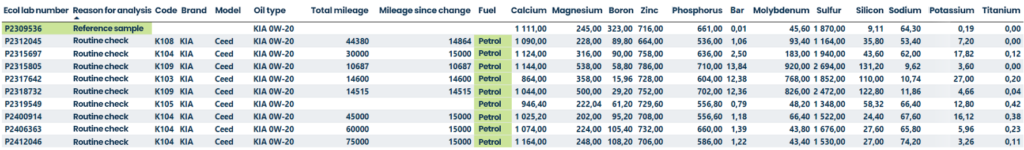
Table 3 is presented in the same way as Table 1. The above table includes cases where the alkaline reserve has been depleted and the i-pH value is reduced.
In these cases, it is clear that the oils should have already been replaced. A high acid number and low i-pH indicate a high content of strong acids, which contribute to the formation of deposits in the system and have a corrosive effect on engine components.
Of note is sample P2412046. It has the lowest mileage since oil change, at 15,000 km. In the table, a similar correlation to that in Table 1 can also be seen: oils from petrol engines have a significantly lower closed crucible met. ignition temperature than oils from diesel engines.
Having discussed parameter changes in the first part of this article, it is now worth looking at additives. To this end, the elements present in fresh oils were collated and compared with the same oils after service. The tables below show the results of the additive element analysis. The first row of each table shows the results for fresh oil and the following rows contain the results of the in-service oil samples. Each table relates to a different oil. The samples with the most data available have been selected for analysis and a short commentary with observations has been added to each table.

Sample P2309952 had an increased magnesium content and slightly reduced boron and molybdenum content compared to the reference.

Slightly elevated levels of magnesium and slightly reduced levels of boron and molybdenum were observed.

A slight decrease in boron was noted. The high potassium content is due to the presence of coolant in the oil.
An increase in magnesium, barium, molybdenum and sulphur was observed in cars where the first oil change took place, i.e. where the total mileage does not exceed 15,000 km. This is most likely related to the use of sealing pastes, as discussed in the first part of the article. At the same time, a decrease in boron content was observed in all samples.

An increase in magnesium and silicon was observed in sample P2405989. This may be related to the engine overhaul carried out, as described in the first part of the article. Decreases in boron were also noted.

A decrease in boron content was observed.

A decrease in boron content was observed.

A decrease in boron and molybdenum content was observed.
In most cases, decreases in boron and molybdenum were noted. It is worth considering by what percentage of the initial value of a given oil the individual elements can decrease. Based on experience and industry knowledge, a decrease in element content of up to 30% with respect to the value of the reference oil was considered acceptable.
In the cases analysed, the boron content often fell below 30% of the fresh oil value. The reduction in boron or molybdenum content should be analysed in correlation with other parameters. It is also important to understand the role of boron in a given oil (e.g. as an oxidation inhibitor). Differences in boron content may result from topping up the oil or using a different product than declared by the vehicle user. In addition, a particular additive may run out more quickly under certain operating conditions, while other additives remain active. Therefore, an oil cannot be disqualified solely on the basis of a decrease in one or two elements.
Not all elements in the tests will show a decrease, which does not mean that the additive chemicals are not depleted. Additives can over-react, leaving elements visible in ICP tests. Elements that decrease may come from lubricity additives, dispersants or solids that are deposited on an oil filter, for example.
Elemental testing as an additive is a valuable complement to other data, but should not alone determine the suitability of the oil.
To determine a safe oil change interval, it is important to ensure that other factors do not adversely affect the condition of the oil. Key parameters such as kinematic viscosity and flash point must meet the requirements. Also, wear elements and those from contamination should be within safe ranges. The presence of fuel or coolant in the oil can indicate a fault that affects these parameters. Moreover, even the correct operation of the vehicle and oil can have a significant impact on them. Therefore, the samples used to determine the safe oil change interval must come from cars operated under normal conditions and without mechanical faults.
An important conclusion is the difference in flash point of oils from petrol and diesel engine operation. For petrol engines, the ignition temperature is significantly lower than for diesel engines due to differences in fuel characteristics. For diesel engines, the ignition temperature determined by the closed crucible method is a key indicator for assessing the suitability of the oil for continued operation and must not decrease too significantly.
Elemental analysis indicated a decrease in the content of additives such as boron and molybdenum. Nevertheless, their reduction should not be the only criterion for determining the suitability of the oil for further use. It is merely an additional element to be considered in the context of other parameters.
A mileage at which the i-pH value does not fall below 4.5 is assumed to be a safe oil change interval. Reduced alkaline reserve and additive content are accepted, provided the other parameters are within safe ranges.
Analysis of the acid number and base number indicates that 10,700 km for petrol engines and 14,500 km for diesel engines can be considered a safe oil change interval. It is at these values that the acid number exceeded the base number. However, it is worth noting that the oil sample with the highest mileage – 25,000 km – retained acceptable parameter values, albeit close to the end of their standard. The other samples with acceptable values had mileages below 16,000 km (Table 1).
A universal safe oil change interval cannot be clearly defined, as it is influenced by many factors, such as the car and engine model, the driving dynamics of the driver, the type of fuel and the oil used. However, based on the above analysis, an approximate range for a safe oil change interval of 10,700 – 16,000 km can be indicated.
It is important to note that the range presented is based on a limited number of samples, which narrows the analysis to a small group of makes, vehicle models, engines and oil types. A larger number of samples could have allowed a more precise estimation of this interval. Nevertheless, this analysis provides valuable information on oil change intervals and changes in oil parameters during operation.
[1] Adam Malcolm, Measuring Risk Potential In Lubricants With Acidic Components
1. Key parameters of oil degradation:
2. Parameter changes and mileage since oil change:
3. Factors affecting oil degradation:
4. Results of element analysis in oils:
contact our specialist, diagnostic or laboratory team:


Nie udało się nawiązać połączenia z siecią. Upewnij się, że masz dostęp do internetu, a następnie odśwież stronę, aby kontynuować korzystanie z serwisu.

