
“Project Fleet”: part 1 – analysis of wear elements

This article is the first part of the findings of the research project ‘Project Fleet’, conducted by the Ecol Oil Analysis Laboratory. You can read more extensively about the assumptions in this article.
“Project Fleet” – scope of analysis
Any oil, including that from passenger car engines, can be analysed. We often wonder whether the oil change interval recommended by the manufacturer, e.g. 30,000 km, is not too long and whether it should not be shortened. We will try to answer these and other questions in a series of articles on passenger car engine oil testing.
The following scope of analysis was adopted for the research:
1. Kinematic viscosity at 100°C [PN-EN ISO 3104:2021-03]
2. Kinematic viscosity at 40°C [PN-EN ISO 3104:2021-03]
3. Viscosity index [PN-ISO 2909:2009+ Ap1:2010]
4. Elements (calcium, magnesium, boron, zinc, phosphorus, barium, molybdenum, sulphur, krze, potassium, sodium, lithium, titanium, iron, chromium, tin, aluminium, nickel, copper, lead, antimony, manganese, vanadium, silver) [ASTM D5185-18]
5. Index PQ [ASTM D8184-18]
6. Acid number [ASTM D664-18e2]
7. Base number [PN-ISO 3771:2012]
8. I-pH [PB 07.32.00_01]
9. FTIR diagram (including determination of oxidation, nitration, sulphation, qualitative glycol content and soot content) [ASTM E2412-23a]
10. Water content Karl Fisher method [PB 07.31.00/01]
11. Flash point of the closed crucible metre [PN-EN ISO 2719:2016-08+A1:2021-06]
The test determines the viscosity class of the oil according to SAE (Society of Automotive Engineers) standards and makes it possible to check whether the oil maintains the required viscosity class or whether it has decreased. A drop in viscosity class can indicate the presence of fuel in the oil.
Combining the results of oil viscosity tests at 40°C and 100°C allows the viscosity index to be calculated.
Viscosity is usually determined at 40 and 100 °C, from which the viscosity index can be determined – a parameter describing the temperature dependence of oil viscosity.
Elements are divided into additives, impurities and wear elements. Additives may decrease as the oil is used. An increase in silicon levels in the context of contaminants can signal the presence of dirt or dust, suggesting that something is getting in from outside. The presence of potassium and sodium often indicates coolant getting into the oil. Wear elements, such as iron, chromium, tin or aluminium, can indicate wear on engine components, depending on which ones are present. Elemental testing can detect these problems at an early stage.
The wear parameter expressing the number of ferromagnetic particles, in combination with the study of non-ferromagnetic elements (e.g. copper and lead), allows additional interpretation of the analysis results.
The acid number directly indicates the content of acid products in the oil and is a parameter that determines the degree of ageing of the oil. An increase in the acid number indicates a higher amount of acid products, which indicates the progressive degradation of the oil. Acid products are formed by exposure to heat or oxygen from the air, forming carboxylic acids, aldehydes and ketones, among others.
The alkali number indicates the content of cleaning additives in the oil, such as detergents and dispersants. Its decrease indicates oil degradation. There is a correlation between the acid number, which increases as the oil is used, and the base number, which decreases. It is important that these ratios do not exceed each other – if the acid number exceeds the base number, this is a worrying signal that clearly indicates the need for an oil change.
The parameter I-pH correlates with the acid number and base number. A low acid number and low I-pH indicate a high amount of weak acids, while a high acid number and low I-pH indicate the presence of more strong acids.
This is an indication of the chemical purity of the oil. Each oil has its own characteristic spectrum. Here, we can determine ageing parameters, oxidation or glycol content (the presence of coolant in the oil).
The Karl Fischer method is the most accurate method for measuring water content, with up to 1,500 mg/kg being accepted as the norm, which corresponds to approximately 0.15% water in the oil.
The ignition temperature is the point at which the oil ignites when the ignition initiator is applied. Fresh oils typically have an ignition temperature above 200°C, as the oil is used, this ignition temperature may decrease. A reduction in the oil’s flash point may indicate the presence of fuel in the oil.
project assumptions
In a series of articles on engine oil testing, we will try to answer questions such as what are the typical values of wear elements and their limits, how many kilometres can we drive on the oil and what is the optimum test range for engine oil from a passenger car. The results of the analyses are subject to ongoing analysis, so we are currently unable to list all the conclusions of the research. Some conclusions and insights may emerge in the future. If there are, we will share them with you in future articles.
The analysis was carried out using different engine oils and different cars with different characteristics (displacement, horsepower, etc.) from the Ecol car fleet and from Ecol employees. The project is still in progress. At the moment, more than 100 samples have been tested.
Sampling for analysis took place on a warm engine 15-30 minutes after it was switched off. In most cases, samples were taken using a vacuum pump and a probe inserted through the dipstick hole. In other cases, where it was not possible to use a vacuum pump, samples were taken during an oil change. Elemental content tests were also carried out 2 and 15 minutes after engine shutdown. The results were identical, indicating that the time after engine shutdown had no effect on the elemental analysis results.
analysis of elemental results from passenger car engine oils
One of the main research objectives is to establish safe concentration ranges for wear elements. For this, the statistical method described in ASTM D7720 (‘Statistically Evaluating Measurand Alarm Limits when Using Oil Analysis to Monitor Equipment and Oil for Fitness and Contamination’) was used and the results analysed, comparing them with data provided by car users.
The studies presented here include elemental determinations by ICP and PQ index. The elements determined are particles smaller than 5 microns, expressed in ppm (parts per million) or mg/kg. The Particle Quantifier (PQ) index is a dimensionless unit that expresses the number of ferromagnetic particles regardless of their size.
In this article, we will focus on the levels of elements from wear on mating engine components and from contaminants. Wear-related elements include iron, chromium, tin, aluminium, nickel, copper, lead, antimony, manganese, vanadium and silver. Elements characterising impurities include silicon, potassium, sodium, lithium and titanium. Impurities are understood to be those from the environment, which may have entered through the air filter, for example. In some situations, this could be coolant, other oil, additives such as ceramisers or other unspecified impurities. Some test elements, such as zinc, which can be both a wear element and an additive component, are not taken into account.
Below is a table containing the median values of wear elements and impurities for a given manufacturer. This gives an overview of their level and which elements are present in a particular brand. However, please note that the table does not include a breakdown by engine type, fuel type, mileage since replacement or total mileage.
Tables of elemental values are presented later in this article. The colours next to these values do not indicate the limits of the elements in question, but are intended to draw attention and to help distinguish larger values from smaller ones.
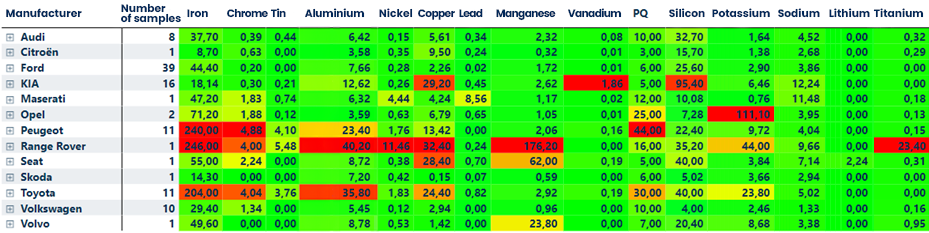
At first glance, the high values of the wear elements for the Peugeot, Range Rover and Toyota brands can be seen. However, it is worth noting that only one sample was examined for the Range Rover brand, which is not a representative reference. The wear values in this sample differ significantly from the rest, suggesting excessive wear on certain engine components; particularly indicated by the high manganese content. In the case of the Toyota and Peugeot brands, where the number of samples is larger, these results may be related to the wear characteristics of these engines, where friction processes may be more intensive than in other brands.
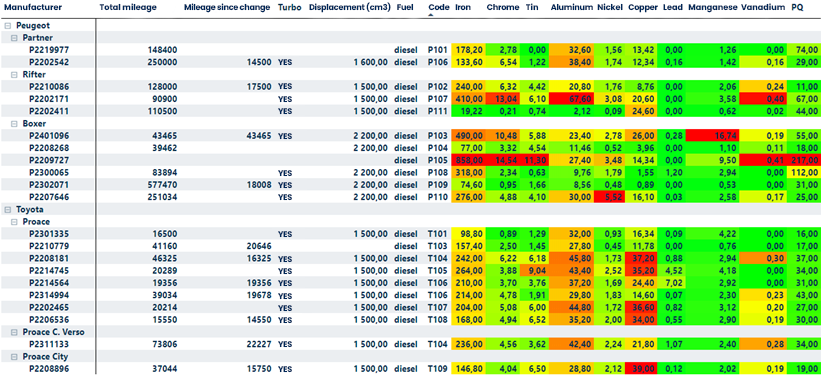
Table 2 shows detailed elemental results from oil samples from Peugeot and Toyota cars. Identification of the origin of the samples is made possible by the coded car registration (code). As can be seen, the samples come from different cars with different mileage since oil change, but with identical engine displacements (1500 and 2200 cm³), except for one 1600 cm³ engine.
The levels of wear elements are similar, which may indicate that this is the wear characteristics of these engines. It is worth noting the deviations in samples P2209727 and P2202171. Based on the available data, it is clear that they deviate from the rest of the results, which may indicate increased wear processes (e.g. galling of certain engine components). Sample P2401096 showed a high concentration of iron, which is related to the very high mileage on one oil (43465 km).
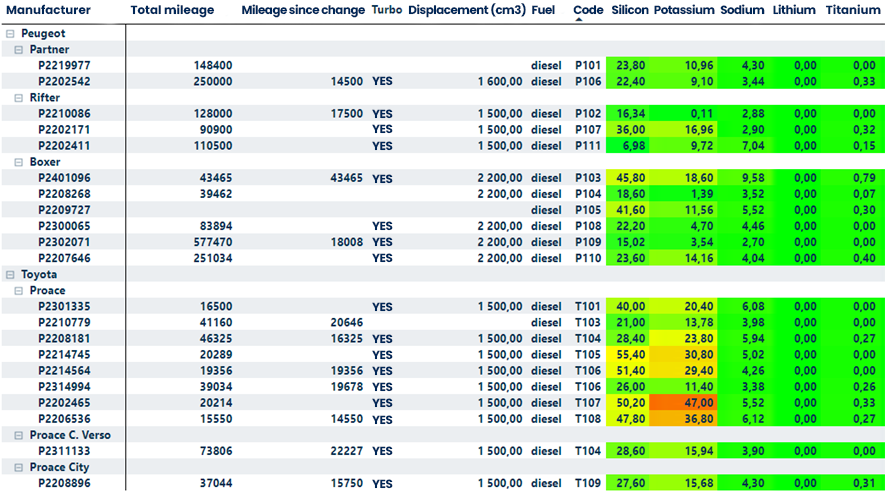
In Table 3, the elements with the highest values in each sample are silicon and potassium. Silicon in engines most often comes from contaminants entering through the air filter or from the presence of assembly pastes. In combination with aluminium, it can indicate wear on aluminium pistons. Potassium is often associated with coolant getting into the oil. Elements such as sodium, potassium, boron and molybdenum usually appear as a result of coolant contamination in the oil. Potassium can also come from environmental contamination.
No critically high elemental values were observed in the table in question. Only slightly elevated silicon and potassium values in samples P2202465 and P2206536. Given the low mileage of these engines (15,000-20,000 km), it can be assumed that these are new engines and the elevated values may be related to residues of preservatives (anti-corrosion) or assembly pastes.
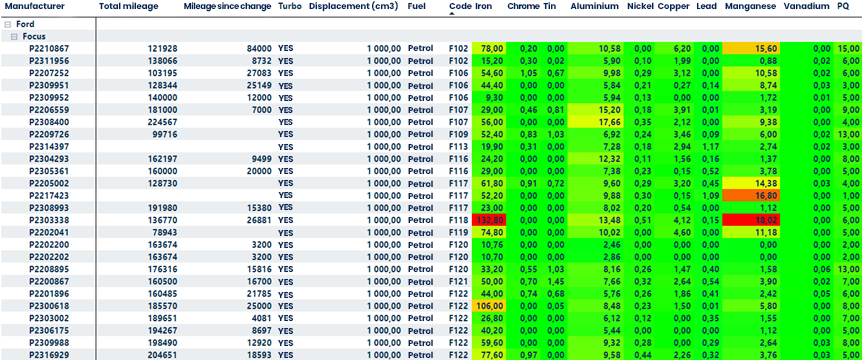
The above table shows the wear characteristics of the Ford Focus petrol engines with a displacement of 1,000 cm³. The data are presented in the same way as in Tables 2 and 3. Comparing the tables, we can see that the values of the wear elements in the case of 1-litre Ford engines are significantly lower compared to Toyota or Peugeot engines. This is most likely due to the design differences of the engines.
In Table 4, the sample that shows deviations is sample P2303338. The other samples from cars with similar mileage since the last oil change (approximately 25,000 km) do not have such high iron values. On this basis, it can be assumed that the wear processes are more intensive in the engine of this car than in the others.
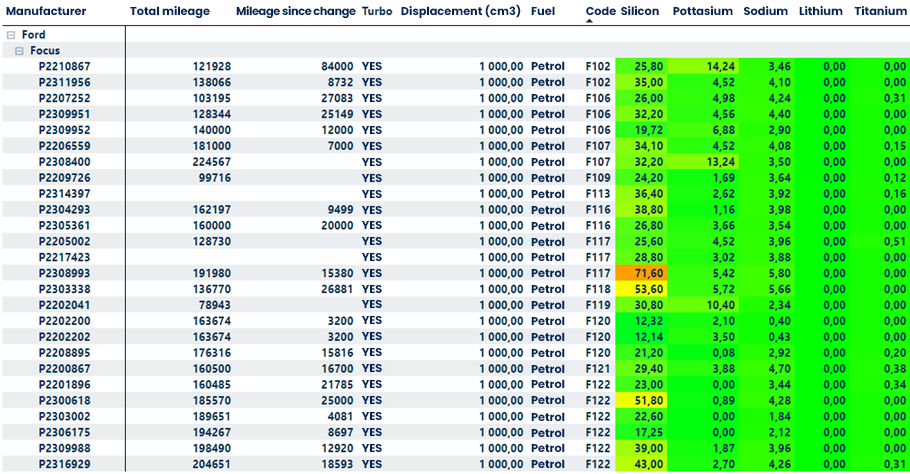
The silicon levels are similar to Table 3. Three measurements were noted where the silicon levels deviated from the rest of the samples. These are car codes F117, F118 and F122.
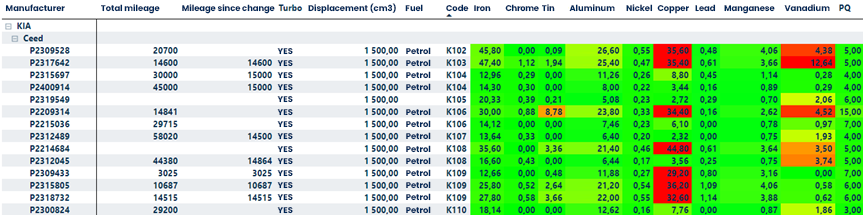
In Table 6, the increased element values highlighted in yellow to red are due to the fact that these cars are before their first oil change. It can be seen that where the total mileage is no more than 21,000 km, the copper content oscillates around 30-40 ppm. Copper is usually a wear element from components such as plain bearings, bushings, sealing agents, oil cooler, camshafts etc.
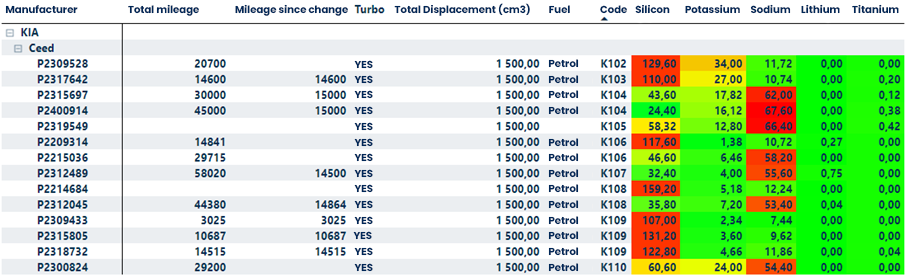
High silicon contents (>100 ppm) overlap with samples with high copper content, i.e. samples before the first oil change. This may be related to the presence of assembly pastes. The high sodium contents in this case have to do with the oil additive package and not the presence of contaminants.
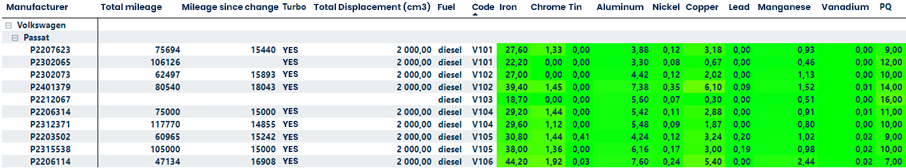
In Table 8, the content of individual elements for all samples is relatively low and at a similar level, which does not indicate the presence of increased wear processes in any of the cars.
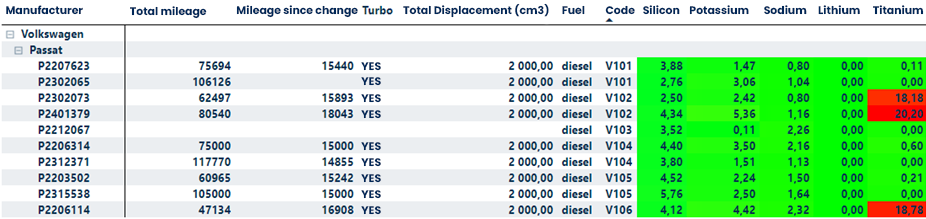
Volkswagen’s 2-litre diesel engines have not experienced any worrying increases in pollutant elements. The high titanium content is not due to contamination or wear, but to the use of oil with titanium technology.
Among the elements classified as contaminants, the problem of coolant getting into the lubricating oil was diagnosed in two samples, which was confirmed by the owners of these vehicles.
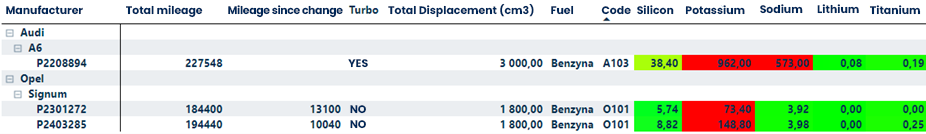
Table 10 shows the elements classified as contaminants from Audi and Opel car oil samples. High levels of sodium and potassium are characteristic of the presence of coolant in the oil. Depending on the coolant, boron and molybdenum may also appear.
In the example above, no elevated sodium content was observed in the Opel samples.
An interesting case is the examination of the engine oil after 1,100 km following a major overhaul of the third-generation 1.8 TFSI engine from Audi. The changes from previous tests are presented below.
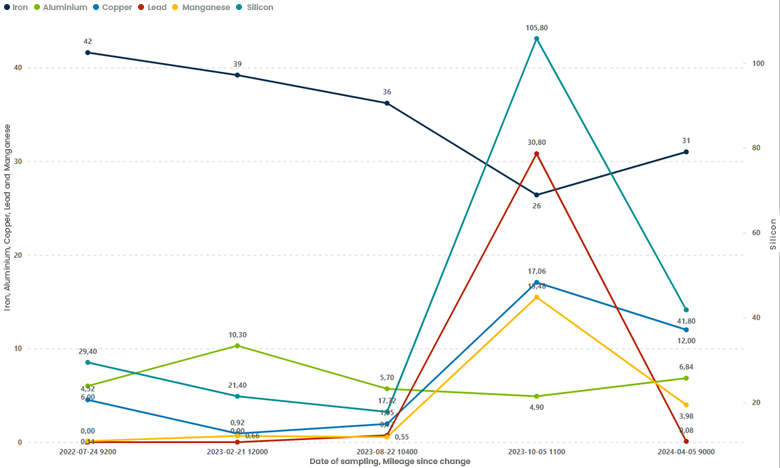
The elemental results on the Y axis are presented in ppm (mg/kg). The first three oil changes shown on the X-axis (from left) show a stable pattern of wear elements (Y-axis left) and silicon (Y-axis right). The changes took place approximately every 10,000 kilometres. The engine overhaul took place in September 2023.
The first oil test after the overhaul took place after 1,100 km. As can be seen, the concentration of wear elements increased, which is most likely related to the lapping of parts and the presence of assembly pastes. The engine parts replaced consisted of components such as the engine block, pistons, pan, valve train, camshafts, crankshaft and many other parts in direct contact with the lubricating oil.
determination of elemental limits
Due to the discrepancies in the wear elements of the different car manufacturers, extremely high results must be discarded in order to generalise. Parameters that appeared during the tests and are found in the tables above, namely iron, chromium, tin, aluminium, nickel, copper, lead, manganese, vanadium, PQ index, silicon, potassium, sodium, lithium and titanium, were adopted for the analysis. Based on the statistical method and a review of the distribution of values, the following ranges were determined.
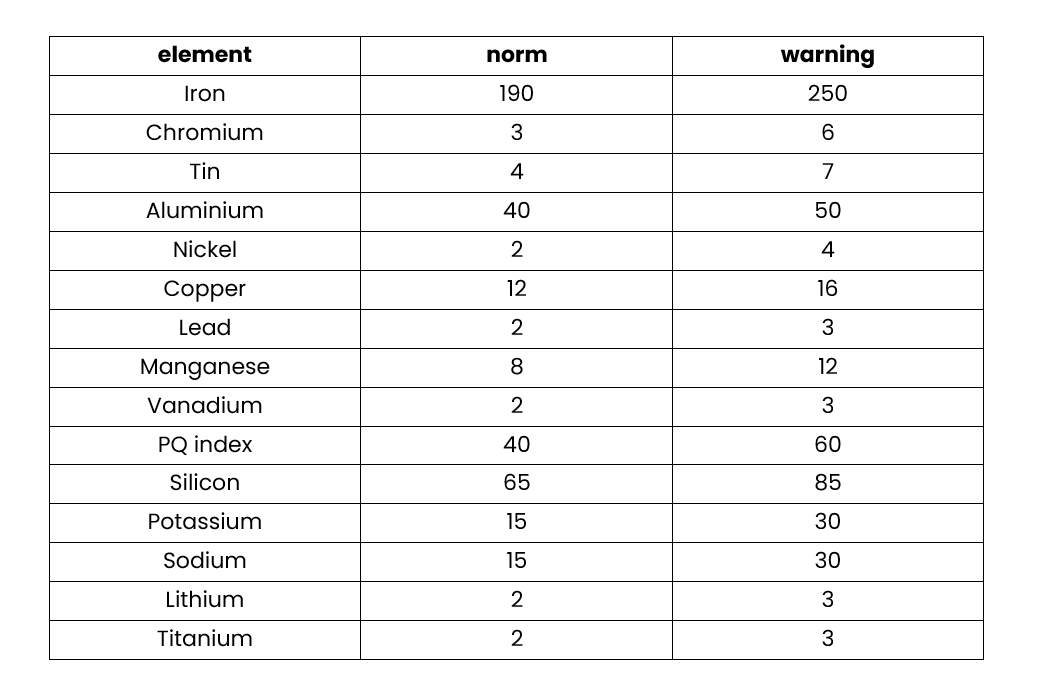
It should be borne in mind that for Table 11 above, mileage since oil change has not been taken into account, so the statistic is based on the entire available population of results. Typically, oil changes occur after a maximum of around 15,000 km. To this end, statistical limits have also been drawn up for all samples with a mileage since oil change of less than 17,000 km.
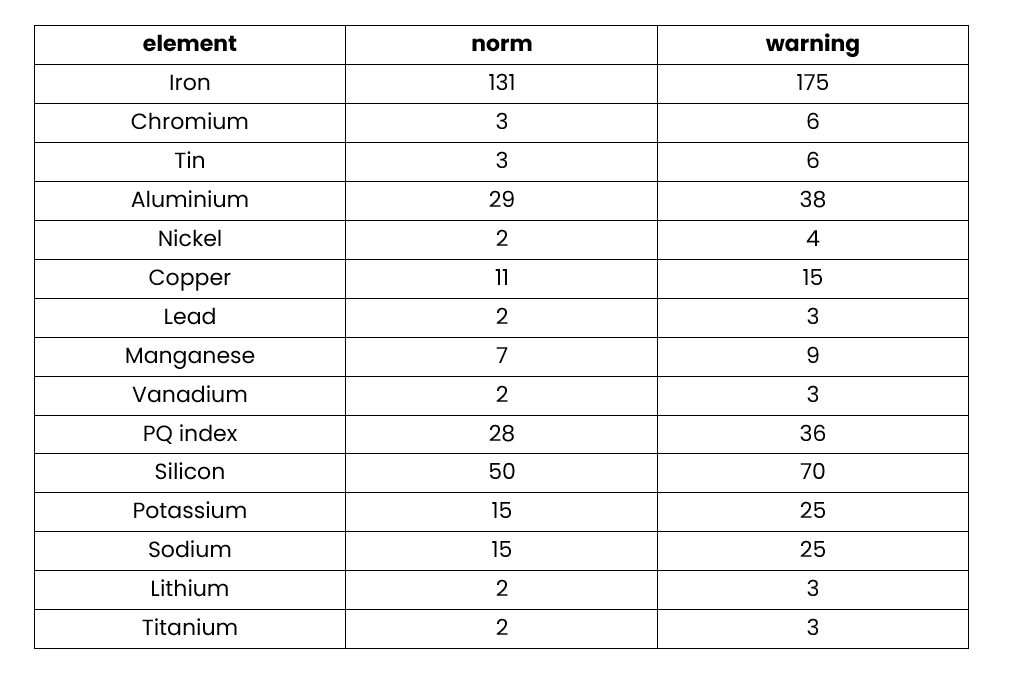
Elements such as lithium and titanium are found very rarely and in low quantities, unless they are a form of additive. Apart from a few samples, titanium was not detected and lithium was detected in only one sample at a level of 2.2 ppm, but without correlation with the other results. Therefore, the limits for these elements are very indicative and attention should be paid to even their smallest concentrations. Both tables containing the limits can be considered correct, as extremely high results were rejected for both, and the results are also influenced by the mileage since oil change.
“Project Fleet” part 1 – conclusions
The main factor affecting element levels is the mileage since the last oil change. After an oil change, the level of the elements in question is very low and then gradually increases as a result of normal wear processes at the interface between mating components (e.g. pan – shaft, piston – cylinder smoothness). The analysis of the results showed no relationship between the total mileage of the car and the level of the elements. Establishing a relationship between total mileage and elemental content could require more research and comparing one type of engine from one manufacturer.
Another factor is the make and type of engine. It was noted that typical ranges can vary from brand to brand, most likely due to differences in engine design. Which element appears in the test also depends on the metallurgy of the engine. An important factor affecting elemental levels is engine overhaul and whether the first oil change has already taken place. After an engine overhaul, there is a sharp increase in elemental levels due to the new parts running in. The absence of a first oil change may indicate a new engine, which also generates an increase in elemental content. Therefore, in addition to the suggested limits in Tables 11 and 12, a number of listed factors affecting elemental levels should also be taken into account.
Elemental testing is able to detect increased wear processes at an early stage, targeting specific engine components depending on the elements detected. In addition to this, the test also offers the possibility of detecting coolant or the ingress of other contaminants into the oil in excessive quantities. The detection of specific elements can help direct the car user to the type of fault. Elemental testing can be a beneficial predictive measure when overseeing the condition of a company’s fleet of cars, buying a used car or when dealing with disputed issues when changing oil at garages. When testing engine oils regularly, it is also important to observe the trend of wear elements, as shown in Figure 1.
These are just elements or as much as elements, which give us many possibilities. In addition to these, we have also done the other studies mentioned in the introduction. We now know that the other parameters give us just as important information as those in the elements, but they require a deeper analysis. In the next article, we will try to answer the question, what is a safe oil change interval? We hope that we have piqued your interest with this article and invite you to read the next publications in the series of oil analysis of passenger car engines.
contact
Do you have questions about oil diagnostics?
contact our specialist, diagnostic or laboratory team:

