Samples from these components were collected by an international team of H-47 operators and delivered for laboratory analysis to characterise wear, properties and contaminants, which change over time and with the number of aircraft operating hours. The lubrication optimisation study revealed further opportunities to evaluate and utilise the data obtained in this process, including determining the excellent performance of specific lubricants under Mil-Spec designation, testing lubricants for compatibility when mixed, and improving the cleanliness of new lubricant to extend component life.
Oil analysis and lubricant testing in the defence sector – optimising rotary wing lubrication
Regular collection and analysis of lubricant samples is key to increasing the reliability and safety of rotary wing aircraft. Research conducted in the defence sector shows that with the right laboratory procedures, it is possible to extend maintenance intervals, reduce costs and minimise machine downtime. Lubricant analysis results provide a solid basis for maintenance decisions and operational optimisation.

oil analysis and lubricant testing in the defence sector
lubrication testing – the Boeing and AMRRI approach
Like most machines, rotary wing aircraft require periodic lubrication to ensure continuous, safe and reliable operation. Optimal lubrication intervals are desirable to maintain system performance while minimising aircraft downtime and maintenance work.
Boeing and AMRRI conducted a Lubrication Optimisation Study (LOS) on the H-47 Chinook helicopter to determine the necessary engineering artefacts to help establish lubrication intervals for selected drive, rotor and landing gear components.

abstract
Boeing and AMRRI conducted a lubrication optimisation study (LOS) on the H-47 Chinook helicopter to establish the engineering basis and artefacts for defining solid lubrication intervals for selected drive, rotor and landing gear components. The primary objective of the study was to perform laboratory analysis of grease samples collected from these components and to characterise how wear, properties and contamination change over time and aircraft operating hours.
To ensure the statistical significance of the analysis, nearly 1,200 samples were collected in two stages between May 2018 and July 2019. Five different operators participated in the sampling. This made it possible to quantitatively determine a variety of environmental operating conditions, such as “hot”, “dry” and/or “salty”.
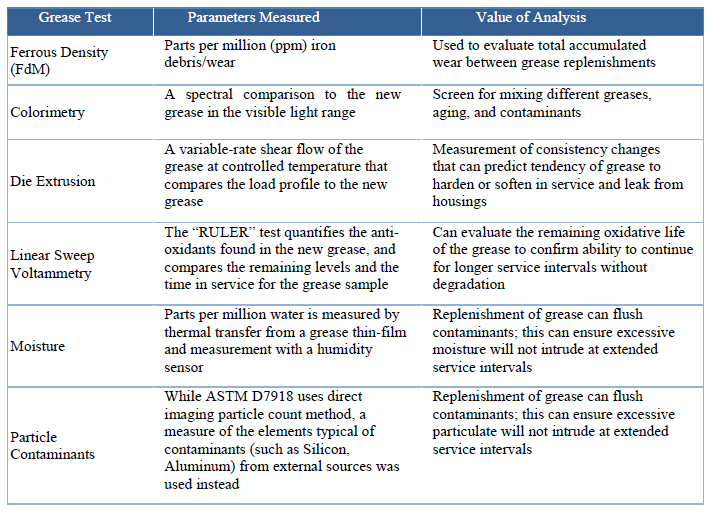
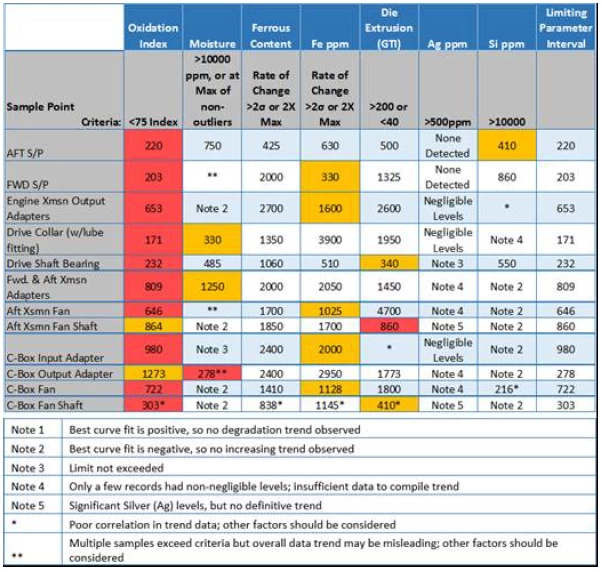
AMRRI evaluated grease samples for ferromagnetic content using FerroQ (FdM – Ferrous Density) testing, colorimetry, consistency profile (die extrusion, shear flow), linear voltammetry (antioxidant properties – RULER), moisture (water content), particle contamination (external sources such as silicon, aluminium/ aluminium), Fourier transform infrared spectroscopy – FTIR (organic contamination) and spinning disc electrode spectroscopy (measurement of non-ferrous element consumption). The primary limiting parameter for the tests was oxidation in most cases, while the secondary limiting parameter was more dispersed.
Boeing conducted an analysis of operational data for each of the selected components. This analysis complemented the lubricant analysis conducted by AMRRI. Together, these analyses formed the engineering basis for the recommended solutions regarding the service frequency of selected drive, rotor and landing gear components. The results of the study showed a reduction in one lubrication interval, five extended intervals and eleven intervals unchanged from the previously established maintenance recommendations.
sampling methodology
regulatory basis and starting point
The development of a sampling procedure and tools that ensured that each sample submitted for analysis was representative of the current condition of the component and lubricant, while protecting the component under test, was critical to the success of this programme. The starting point was the American Society for Testing and Materials (ASTM) D7718 document entitled: ‘Standard Practice for Sampling Lubricants During Operation’, developed in 2011 based on research conducted for the energy industry.
Previous studies have included testing gear surfaces and large and small bearings. Although some of this earlier work was directly applicable to similar types of CH-47 power train components, there are differences in housing configuration and access, particularly with regard to the Chinook 2 helicopter’s drive shaft splines.
sampling tools
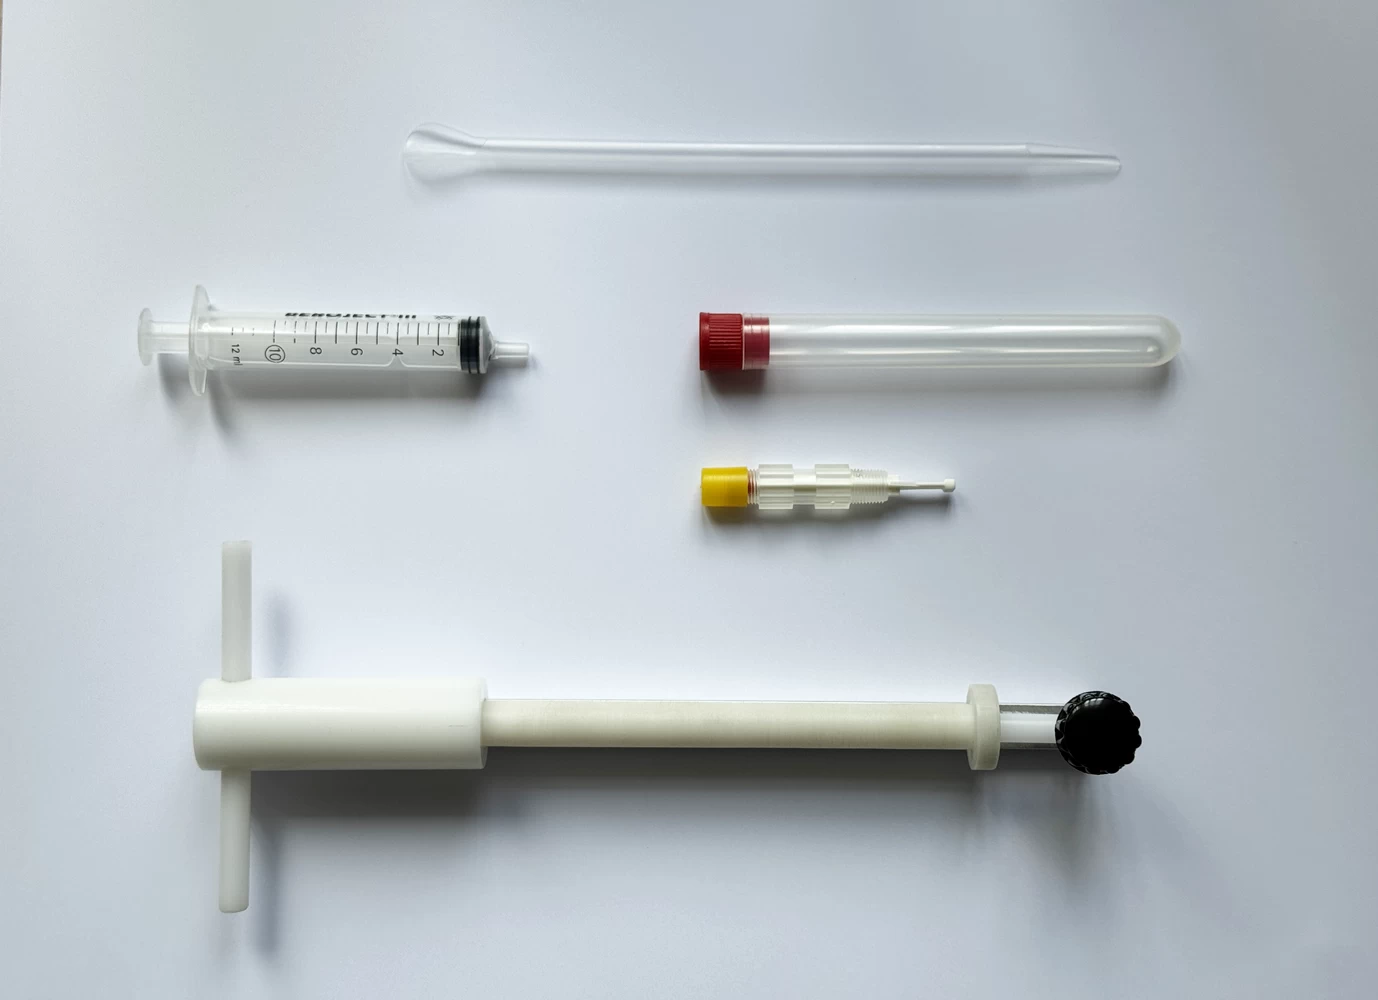
An existing tool, called the ‘Pillow Block Grease Thief’ (a kit for collecting grease from bearings in a housing), shown in Figure 1. It consisted of a plastic spatula used to collect samples from various components of the rotor, drive and landing gear.
sampling procedure
The spatula proved particularly useful for taking samples from the surface of splined gear teeth. Initially, the device was modified so that its profile corresponded to the angle of the splines. However, since splines come in different sizes and it was not possible to develop a universal solution, the spatula was retained in its original shape.
Instructions were provided on how to position the spatula tip at the optimum angle to scrape grease from the tooth surface. Thanks to the soft plastic material of the spatula, this could be done without risking damage to the splines. The wide end of the spatula was used for sampling from components other than splines.
transfer and preparation of samples for analysis
The grease collected in this manner was placed in a standard 6-millilitre syringe from which the plunger had been previously removed. After collecting the appropriate amount of grease, the plunger was replaced and used to transfer the material to the Grease Thief device. The tip had been previously removed from the syringe, allowing for complete transfer of the grease to the device.
The filled Grease Thief was placed in a plastic transport tube, to which an identification label was attached, and then the samples were sent to the laboratory for analysis.
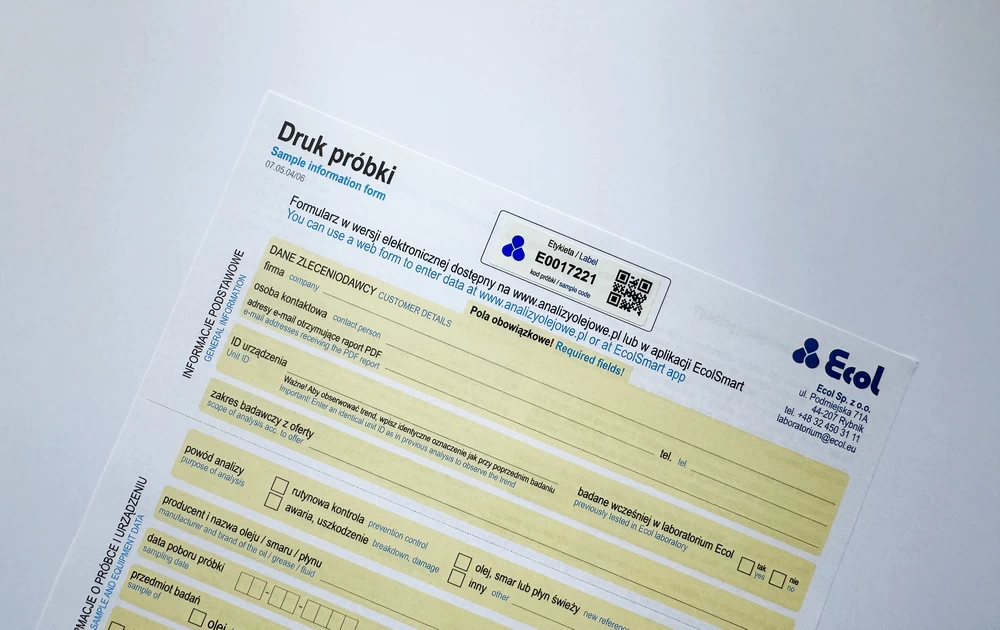
The labels were designed specifically for this project and were included in the sampling kit. They had the sampling locations printed on them, and the identification and frequency of the sampling points were prepared in relation to the service and maintenance schedule.
In each case, sampling was planned taking into account the existing maintenance tasks for the equipment in question, so as to minimise the grease sampling process. A fragment of the identification label is shown in Figure 2. Each label was assigned a unique barcode number for more efficient sample identification.
Each sampling kit came with instructions. Each kit consisted of eight ‘pouches,’ each containing the items shown in FIGURE 1. In addition, soldiers and mechanics involved in the sampling were trained to ensure consistency in the methodology used.
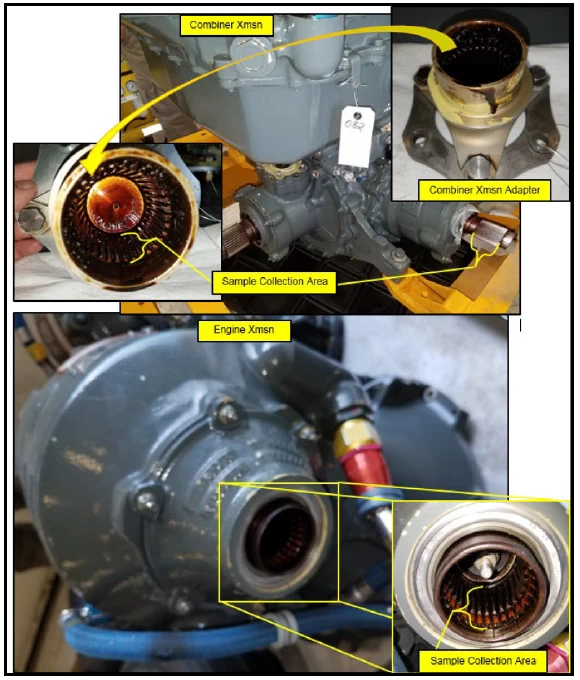
The aim in each case was to collect approximately 1.5 g of grease, which corresponded to approximately the volume of the entire Grease Thief sampler. Each device was evaluated in detail to determine the best sampling point, as shown in FIGURE 3. However, at some points, especially in smaller protrusions, it was not possible to obtain the required amount of grease. Therefore, a summary of analyses was developed and a range of tests was selected for samples with a smaller volume.
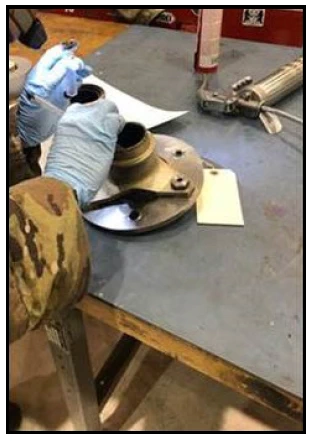
Figure 4 shows a sample collection training session performed using a modified Grease Thief kit. The collection took place during scheduled maintenance.
The tests were optimised for samples containing smaller amounts of grease. High-volume samples, i.e. those containing more than 0.95 g of grease, were sufficient to perform all eight specified tests. Samples weighing more than 0.69 g but less than 0.95 g were designated as ‘low-volume’ samples. Seven tests could be performed with this amount of material, excluding the consistency profile test (GTA die extrusion). Instead, an alternative consistency test was performed with a smaller amount of grease, using a cone and plate rheometer.
Samples weighing less than 0.69 g but not less than 0.35 g were designated as ‘small volume’ samples. Unfortunately, it was not possible to perform consistency profile testing (GTA die extrusion), FerroQ testing (FdM – Ferrous Density) or RULER testing (presence of antioxidants) on these samples. They therefore provided a limited amount of data for this study. Samples with less than 0.35 g of grease were not used in the tests.
The selected set of analytical tests was based on known oxidative stressors, detected sources of contamination in machine applications, and additives present in lubricants that extend their service life. The ASTM test method for evaluating operating greases is D7918. It uses the tests specified in Table 1 and includes a list of key parameters used in the evaluation of greases.
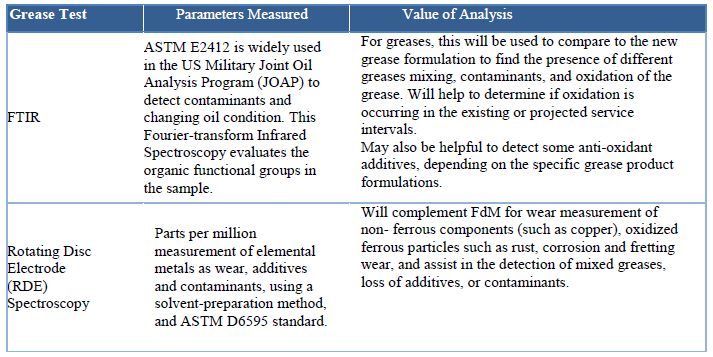
The test suite typically includes two additional tests (Table 2) that are not included in the current version of ASTM D7918. Rotating Disc Electrode (RDE) spectroscopy and Fourier Transform Infrared (FTIR) spectroscopy (FTIR) provide elemental and molecular analysis results and complement the D7918 assessment with monitoring of non-ferrous particles, additives, contaminants and lubricant oxidation.
Although ASTM D7918 includes particle counting and direct thin-film imaging techniques, it was determined that their use would be ineffective due to the condition of the samples and the insufficient optical transparency of the grease. Therefore, the particle counting method was replaced by monitoring the silicon (Si) level in the grease, measured using rotating disc electrode spectrometry. It was expected that the most common source of external particles would be sand or other contaminants resulting from the working environment and air turbulence. For this reason, silicon was considered a suitable indicative parameter for assessing the ingress of such particles.
sample analysis
Many international operators participated in the project, and the scope of the research covered up to 1,200 samples. The initial goal was to obtain at least 30 samples from each location (selected sampling point) to ensure the statistical significance of the grease analysis results and to be able to determine the optimal interval.
Operators were given sampling kits, each consisting of eight ‘pouches’. Based on an analysis of maintenance intervals, several variants of sampling kits were prepared. The variable in each kit was the attached labels, tailored to the component undergoing maintenance or servicing.
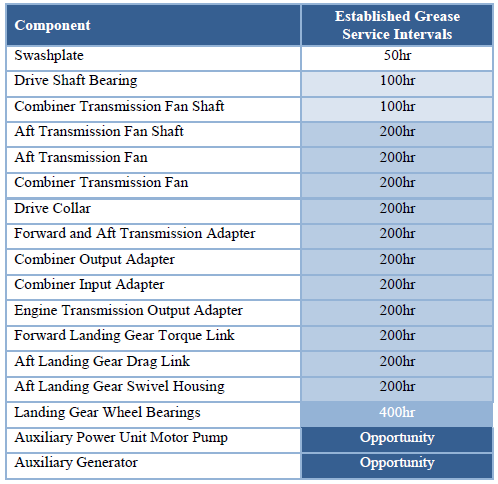
TABLE 3 presents a list of components covered by the study, together with the currently applicable grease service intervals. These intervals were determined on the basis of engineering knowledge and operating history.
Parameters and test procedure
The results for individual grease samples were compiled in order to determine seven parameters affecting its durability: iron (Fe), silver (Ag) and silicon (Si) content, ferrous wear (FerroQ), moisture, die extrusion index (consistency profile – consistency under dynamic conditions) and oxidation level. These parameters are presented in the graph as a function of hours since the last service or grease replacement to determine the point at which they begin to deteriorate.
Based on the trend of parameter changes in relation to the number of flight hours, curve fitting (point approximation) was applied. In most cases, linear relationships were obtained, while some were logarithmic. To calculate the number of flight hours, equations of fitted curves corresponding to the target critical level of parameters were used.
Determining optimal intervals
The optimal service interval was defined as the number of operating hours after which the lubricant should be replenished before degradation occurs. This ensured that each component was protected from wear and damage by replacing the lubricant with new lubricant before it degraded or accumulated significant contamination.
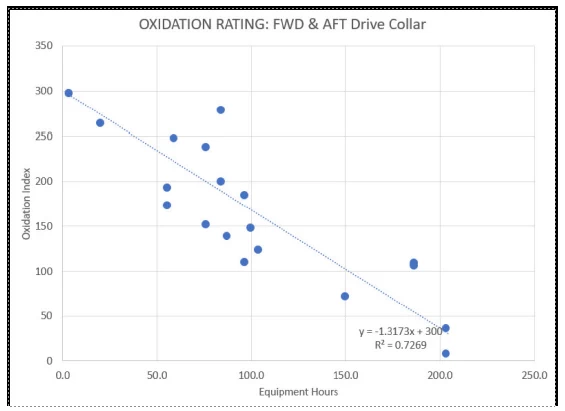
Przykład regresji zastosowanej do określenia optymalnego interwału zaprezentowano na RYSUNKU 5. Dla parametru „Ocena utlenienia” docelowy poziom został wyznaczony na wartość 75, co odpowiada 25% pierwotnego poziomu ochrony dodatków przeciwutleniających. W tym przypadku równanie dopasowanej krzywej wskazuje wartość 171 godzin lotu.
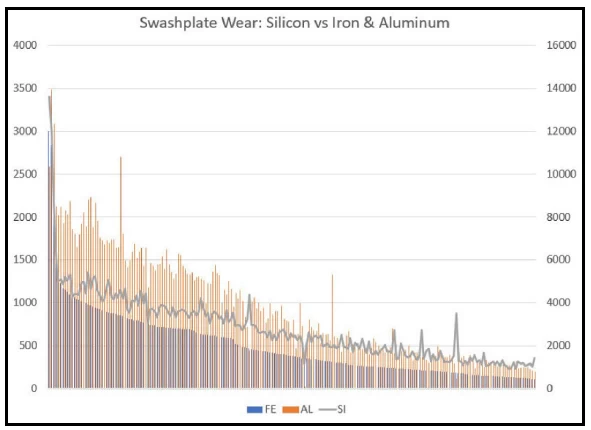
The results of the research revealed a correlation between the amount of silicon detected in the lubricant (usually caused by sand or dirt entering during maintenance or operation) and the degree of wear, measured on the basis of both iron (Fe) and aluminium (Al) levels. This correlation is shown in Figure 6.
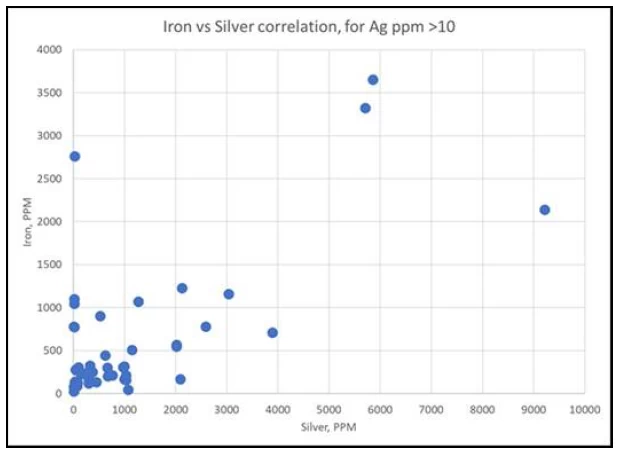
Another important discovery was the observation of significant levels of silver in grease samples. The study showed that silver was used as an anti-friction coating on some bearing cages and spline surfaces. Most grease samples contained low levels of this element, but some had elevated levels, reaching up to several thousand parts per million (ppm).
High levels of silver wear are not necessarily a problem, as this coating is designed to reduce wear and damage to the surface structure of the drive surfaces. However, a correlation was observed, revealed by principal component analysis (PCA), between high (>10 ppm) silver levels and elevated iron levels in the same locations, as shown in FIGURE 7.
This indication may enable the use of periodic grease analysis as a useful indicator of future wear, as well as a tool for targeting maintenance and inspection activities.
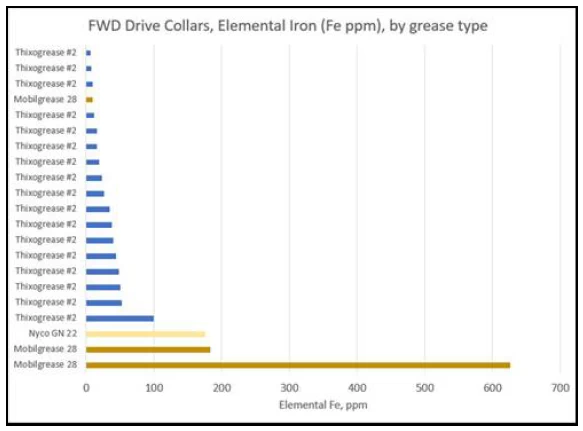
Although the project was not directly aimed at comparative evaluation of lubricant products, some observations were made that confirmed the effectiveness of certain lubricants in their intended application. The graph in FIGURE 8 shows that in several cases where an alternative lubricant was used, wear resistance was lower than in components where the recommended lubricant was used.
This does not constitute an assessment of the relative value of these products, but merely indicates the consumption levels observed in a specific application with a limited number of samples. These results confirm the suitability of the basic product.
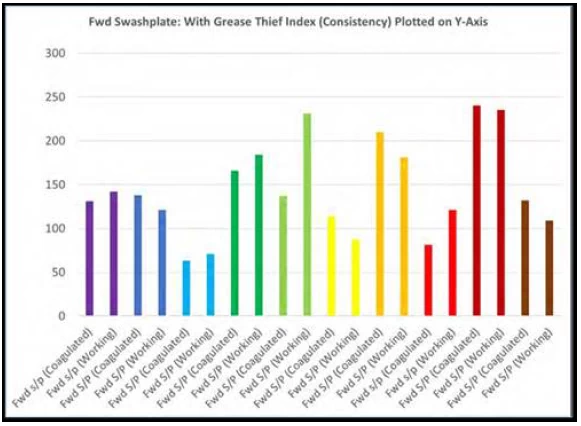
Initially, samples were taken from the control disc in many places to determine the behaviour of grease that did not come directly from the ‘working’ area of the bearings. After some time, experienced mechanics described the grease in the steering disc, after a specified period of operation, as being most similar to the ‘working’ grease – as opposed to the ‘coagulated’ grease located further away from the lubricated part.
To assess the validity of this observation, samples were taken from both locations and compared. Surprisingly, the grease from both locations on the same control disc showed very similar results. The analysis included a comparison of consistency, wear level, and remaining antioxidant content. These results indicated that the grease from both zones does not separate, but flows and mixes during operation.
Parameters that, as expected, should vary depending on the distance from the working part (e.g. the level of wear particles and antioxidants) showed similar values. Based on this observation, further samples were taken from the working area of the control disc housing.
The results of the consistency comparison using the die extrusion method are presented in Figure 9. All 11 components listed in Table 4 were analysed using seven identified parameters. On this basis, the recommended maintenance intervals for the tested components were determined.
Combining grease sample testing with operational data
In addition to grease analysis, Boeing utilised field maintenance data obtained from operator logbooks, part removal records, stage maintenance documentation, and other materials enabling historical and engineering data analysis. A Weibull distribution analysis was used to generate the characteristics. Conservative baseline principles were adopted for the analytical process to ensure the continued safe operation of the H-47 helicopter.
The results of this analysis provided justification for the lubricant sample evaluation and further guidance on determining recommended service intervals. Historical data and lubricant sample test results were then combined in a statistical evaluation to determine optimised, data-driven service intervals.
Maintenance information was also used to determine the age of components – both new and since the last service – providing greater insight into the significance of the data set. This enabled the assessment of grease consumption trends and correlations with component age.
Results and practical significance
The research resulted in the extension of most lubrication intervals – in many cases, the intervals between services were doubled compared to those currently used by various operators. This extension gives each operator the opportunity to adjust lubrication intervals to their own needs, reducing downtime and maintenance costs while ensuring continuous and safe aircraft operation.
Another advantage of the study is that the designated service intervals can be adjusted to fit existing maintenance intervals. This supports Boeing’s efforts to optimise technical maintenance.
These results translate into fewer service-related downtimes. This translates into an estimated reduction in lubrication tasks from 98 to 56 per 1,000 flight hours and a reduction in service downtimes from 20 to 10 per 1,000 flight hours.
Acknowledgements
This study was conducted with the support of numerous H-47 Chinook operators, including: the Canadian ILS/CH147F project management programme, the US Army cargo fleet management programme, the MH-47 Office technology applications programme, the Netherlands Defence Materiel Organisation, and the UK Ministry of Defence. Each operator provided a significant number of samples at various intervals and operating conditions, which increased the diversity of the data.
Boeing’s extended team included design team members and service engineers who were responsible for developing the Service Bulletin. This document contained sampling instructions in accordance with customer maintenance personnel requirements and aircraft configurations.
bibliography
- American Society for Testing and Materials, 2011. ASTM D7718: Standard Practice for Obtaining In-Service Samples of Lubricating Grease. West Conshohocken, PA, USA.
- Air Transport Association of America (ATA), 2013. ATA MSG-3, Volume 2 (Rotorcraft): Operator / Manufacturer Scheduled Maintenance Development. Washington, DC: Airlines for America.
- Møller, H., Esbensen, K. & Wurzbach, R., 2016. Grease Sampling and Analysis for In-Service Condition Monitoring (CM) of Wind Turbine Blade Bearings. Bilbao, Spain: s.n.
- Pitard, F., 1989. Pierre Gy’s Sampling Theory and Sampling Practice (2 Volumes). Boca Raton, Florida: CRC Press, Inc.
- Wurzbach, R., 2017. How to Determine Grease Compatibility and Why It’s Important. Machinery Lubrication, February.
- Wurzbach, R., 2018. Why Grease Cleanliness Should Not Be Overlooked. Machinery Lubrication, April.
contact
do you have questions about oil and lubricant testing?
contact us directly:

see also
-

Oil diagnostics of piston aircraft engines
The idea of testing the oil working in machinery as a carrier of…
-

Research and analysis for aviation
Oil diagnostic service for piston aircraft engines.
-

Spectrometric analysis of aircraft engine piston oil
Discussion of Guideline No. 3 of the President of the Civil Aviation Authority…